Methodology: AI citation concentration by question category
Prepared Sept. 27, 2026. Revised Sept. 28, 2026. Data through Sept. 27, 2026 (UTC).
Research question
How concentrated are the domains in RunPR's recorded API citation links, and how does that concentration vary by question category?
This descriptive study uses an existing operational sample. It does not estimate the share of all AI citations on the internet, consumer usage, publisher traffic or the causal effect of PR.
Observation window and sample
The joined scan records with citations span June 30, 2026 at 21:38:31 UTC through September 27, 2026 at 08:00:20 UTC. The latest stored citation was created September 27 at 08:04:03 UTC. The extraction excludes records created on or after September 28 at 00:00:00 UTC.
The final citation analysis includes:
- 81,778 recorded API citation links.
- 13,294 responses containing at least one included link.
- 182 scan runs and 19 monitored domains.
- Four engine families: Exa, ChatGPT, Claude and Grok, with historical model variants combined within families.
- 7,060 cited registered domains.
The monitored domains are the subjects of scans. They are distinct from the 7,060 domains appearing in citation URLs. The sample includes operational scans and can include demonstration activity and repeat scans. It is not a count of independent experiments.
Exclusions and provenance
Swipe or scroll sideways to compare all columns.
| Processing step | Rows excluded | Rows remaining |
|---|---|---|
| Starting stored records | 0 | 176,557 |
| URL fails HTTP(S), hostname, IP-address or known-public-suffix checks | 53 | 176,504 |
| Gemini route with unresolved redirect-service attribution | 14,731 | 161,773 |
| Perplexity feed combining search results with citation URLs | 79,995 | 81,778 |
In the Gemini route, 14,724 of 14,731 links use known redirect-service hostnames. We excluded the entire route instead of interpreting its seven other records as a representative engine sample. We did not visit the redirects or infer destination publishers from page titles.
The Perplexity adapter merges search results and citation URLs into one collection. Stored rows do not preserve which list supplied each URL. We excluded its remaining valid URLs from the citation analysis rather than labeling search results as citations. The four retained engine adapters extract citation annotations or a returned citation list. This is API-reported attribution, not an independent audit of whether each page supports each claim.
The storage field indicating live retrieval defaults to that value in the ingestion code. We do not treat it as independent evidence that a destination was fetched or supports an answer.
No rows had a recorded response error. We found zero duplicate (response, exact URL) groups in the stored table. The main analysis retains successful responses from scan runs whose overall status became failed. A completed-runs-only sensitivity is below.
We disclose engine names and recorded model labels below. We do not publish customer identities, prompt text or per-customer results. The exclusions remove 94,779 records, or 53.7% of the starting population. This four-engine result does not stand in for the six-engine product.
Counting unit and normalization
One observation is a stored URL citation in a response. Multiple distinct URLs on the same domain within that response each contribute a link. Repetition across scan runs remains in the primary count.
We parse HTTP(S) URLs, lowercase hostnames, convert internationalized hostnames to ASCII, remove a trailing dot and the leading www. and identify registered domains with tldextract 5.3.0 and its bundled Public Suffix List snapshot. Network suffix-list updates are disabled for reproducibility. For example, news.example.co.uk and www.example.co.uk group under example.co.uk.
The main analysis uses the public registry section of the suffix list. It groups platform subdomains under their registered domain. A private-suffix sensitivity keeps supported hosted sites separate. We do not merge different registered domains owned by the same publisher or split authors hosted on a common platform. Domain is not synonymous with publisher, publication or independent editorial source.
We group by normalized domains, rank by link count and divide the top 10, 100 or 1,000 counts by all included links in the relevant group. We rerank for each category, month and engine. Those groups do not share a fixed top-domain list. Ties do not affect cumulative counts at a cut point because tied domains have equal counts.
Question categories
We use the stored prompt-category labels, without publishing prompts:
- Brand: questions about a named brand.
- Discovery: category or need-based discovery questions, designed to avoid naming the monitored brand.
- Competitor: comparison questions involving a brand and competitors.
- Founder: questions about a founder.
- Topical: questions about the subject matter relevant to a monitored domain.
These are product category labels, not manually adjudicated labels for this study. Prompt templates, edits, engine mix, domain mix and repetition can differ across groups. We do not isolate question type as a causal variable.
Main results
Swipe or scroll sideways to compare all columns.
| Group | Links | Domains | Top 10 | Top 100 | Top 1,000 |
|---|---|---|---|---|---|
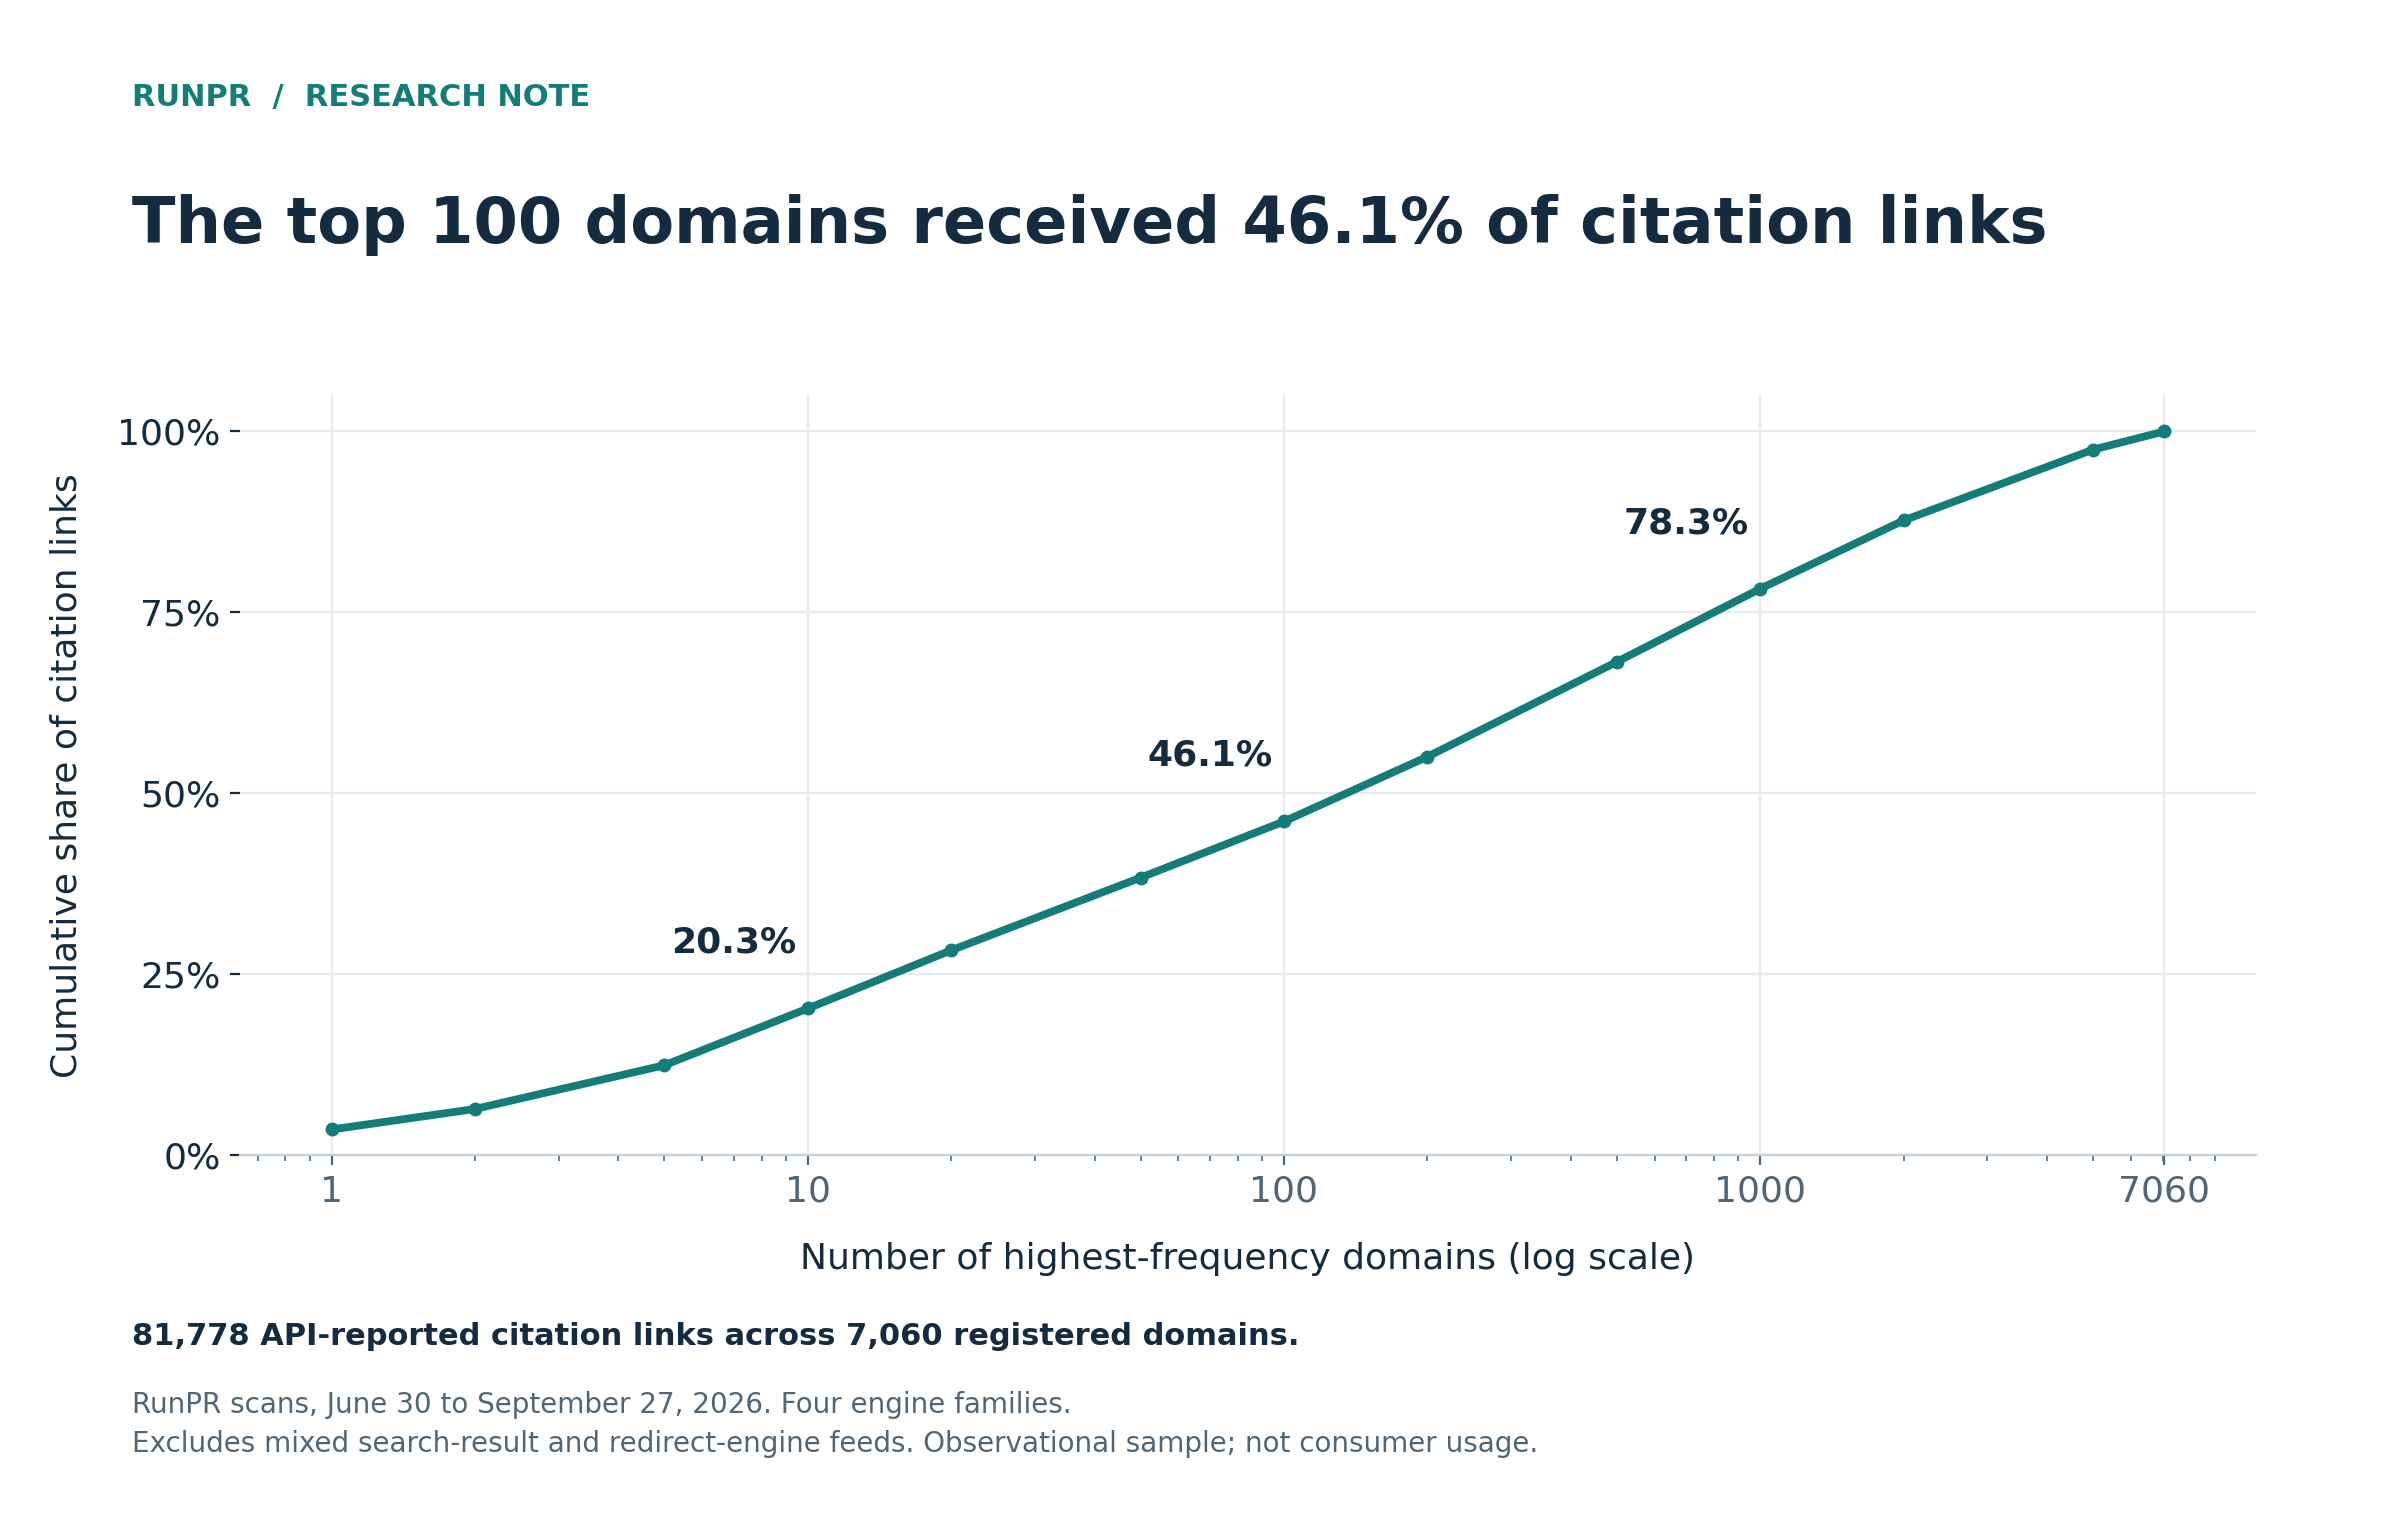
| Combined | 81,778 | 7,060 | 20.3% | 46.1% | 78.3% |
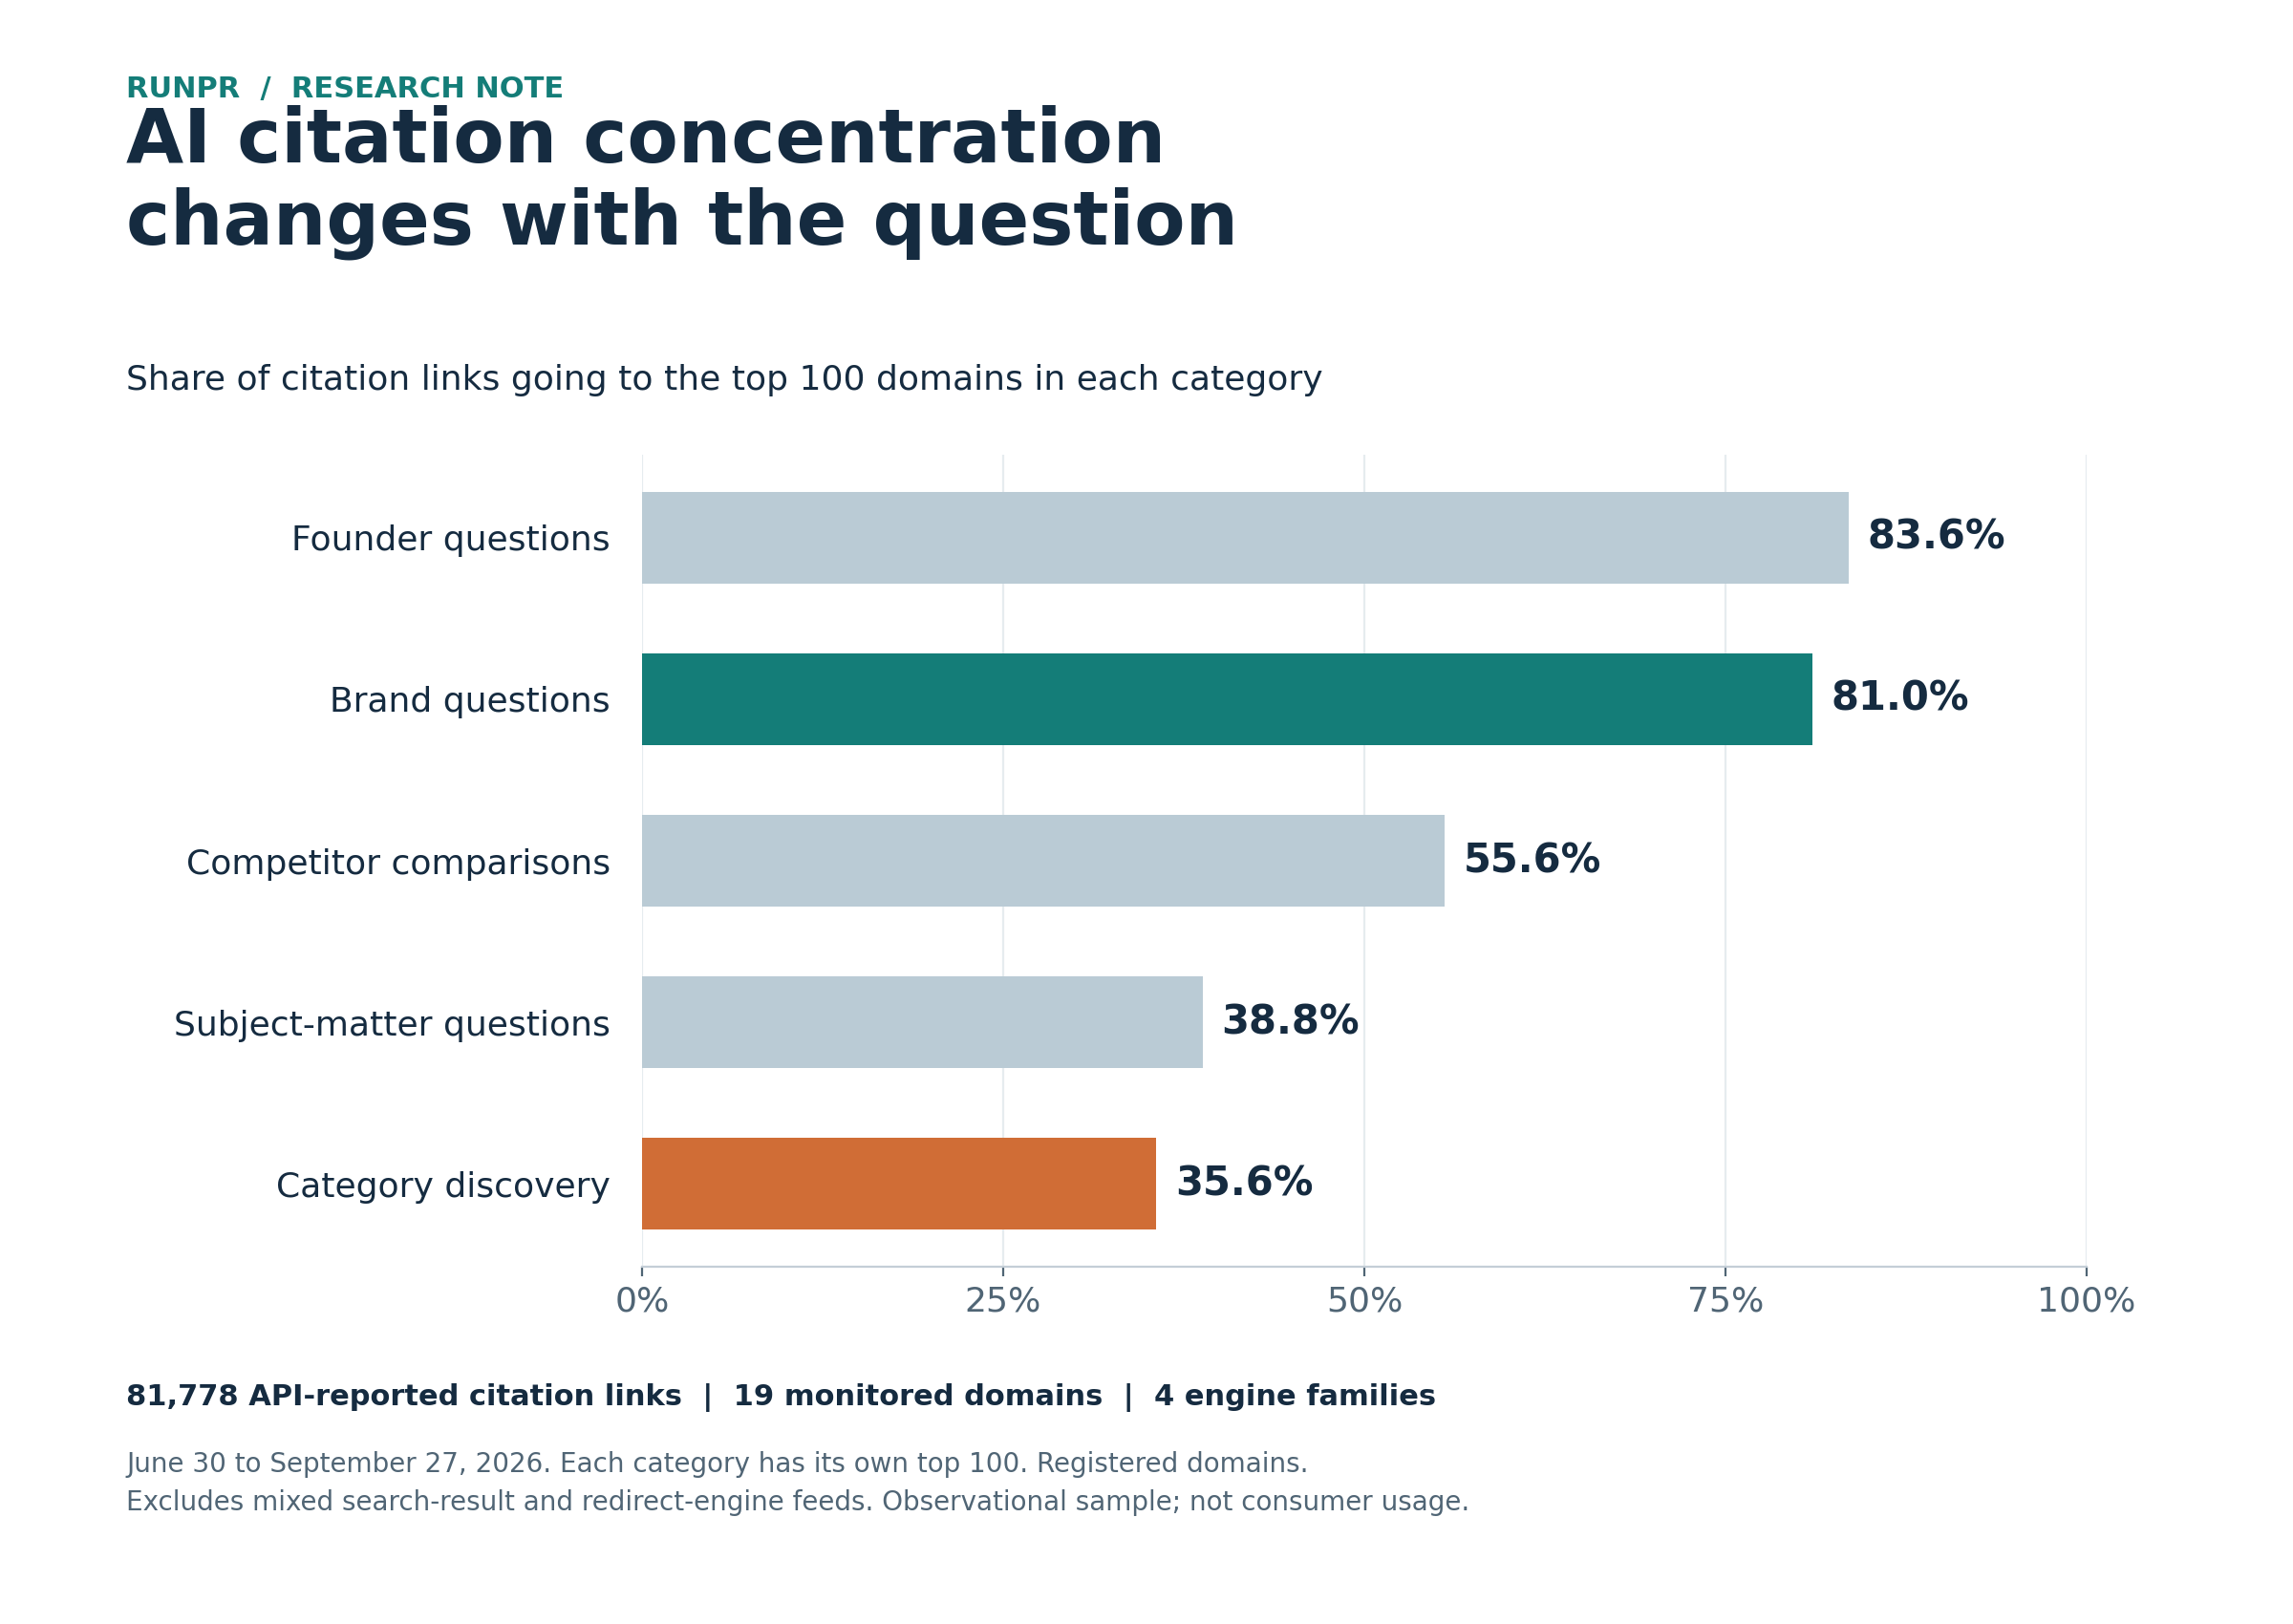
| Brand | 20,613 | 1,078 | 46.4% | 81.0% | 99.6% |
| Discovery | 30,101 | 4,001 | 11.4% | 35.6% | 79.5% |
| Competitor | 10,347 | 1,430 | 18.7% | 55.6% | 95.8% |
| Founder | 10,112 | 491 | 42.0% | 83.6% | 100.0% |
| Topical | 10,605 | 2,348 | 16.9% | 38.8% | 83.5% |
Founder has fewer than 1,000 distinct domains, so its top-1,000 share is 100% by construction. It is not evidence of unusually consistent engine behavior.
Interpreting the category comparison
Named-brand and founder questions about 19 monitored domains naturally narrow the set of relevant sources. Company sites, profiles and database listings may be appropriate answers to those questions. We did not classify those source types or control the entity mix, so concentration should not be interpreted as an engine preference independent of the question.
Founder and topical groups are similar in size (10,112 versus 10,605 links) but have top-100 shares of 83.6% and 38.8%. Their difference is not explained by total link volume alone. It does not eliminate entity, topic, engine or repetition confounding. We did not run an equal-sized resampling experiment.
Sensitivity checks
Swipe or scroll sideways to compare all columns.
| Alternative count or weighting | Denominator | Overall top-100 share |
|---|---|---|
| Primary URL-link count | 81,778 links | 46.1% |
| One domain per response | 61,831 response-domain pairs | 35.0% |
| Private suffixes split hosted sites | 81,778 links | 46.1% |
| Completed scan runs only | 78,750 links | 46.2% |
| Equal weight for each monitored domain | 19 monitored domains | 46.2% |
| Equal weight for each domain/prompt/route combination | 3,072 combinations | 49.0% |
For equal-domain weighting, each monitored domain contributes equal total weight, regardless of how many citation links its scans produced. For equal-combination weighting, each monitored-domain/prompt-slug/provider-route combination contributes equal total weight. We then rerank cited domains using those weights. Neither adjustment creates a representative market sample or removes all confounding.
Limiting each cited domain to one occurrence per response changes brand's top-100 share to 69.0% and discovery's to 29.8%. The category ordering persists under this counting choice.
The largest monitored domain contributes 12.7% of the primary link count. The smallest contributes 544 links. No single monitored domain accounts for most records.
Within-engine check
Each engine has its own brand and discovery rankings:
Swipe or scroll sideways to compare all columns.
| Engine family | All included links | Brand top-100 share | Discovery top-100 share |
|---|---|---|---|
| Exa | 40,450 | 83.0% | 36.4% |
| ChatGPT | 21,078 | 96.6% | 56.3% |
| Claude | 10,705 | 79.8% | 37.9% |
| Grok | 9,545 | 80.4% | 44.0% |
The internal aggregate tables label Exa B, ChatGPT C, Claude D and Grok E; family A is Perplexity, which was excluded. Differences in prompt, date and domain coverage prevent interpreting this as an engine-quality leaderboard. Exa supplies 49.5% of included links.
Recorded API model routes
The study uses API responses, not consumer-app sessions. We did not select or verify the consumer-default model for each service. Model variants are pooled within engine families, so the study does not estimate a tier-specific effect.
Swipe or scroll sideways to compare all columns.
| Engine | Recorded model or route | Included links |
|---|---|---|
| Exa | exa-answer | 40,450 |
| ChatGPT | gpt-4o | 280 |
| ChatGPT | gpt-5.5 | 1,315 |
| ChatGPT | gpt-5.6-terra | 18,717 |
| ChatGPT | gpt-6-sol | 766 |
| Claude | claude-sonnet-4-6 | 2,453 |
| Claude | claude-sonnet-5 | 8,252 |
| Grok | grok-4.5 | 9,545 |
The excluded Gemini route is recorded as gemini-2.5-flash; Perplexity is recorded as sonar. These are the stored labels, not independent verification of the provider’s underlying model for every historical response. An Aug. 17 migration populated older model fields from route identifiers and assigned grok-4.5 to legacy grok rows and sonar to legacy perplexity rows. Those older generic routes do not establish an exact historical model version. Exa Answer is an API route rather than a disclosed underlying model.
A read-only audit on Sept. 28 reproduced the original 176,557-record total, 53 invalid URLs and all six valid-link engine totals. It did not add later records or change the study results.
Time check
Swipe or scroll sideways to compare all columns.
| Scan-start month | Included links | Top-100 share |
|---|---|---|
| June, one observed day | 2,005 | 51.5% |
| July | 32,171 | 46.2% |
| August | 30,251 | 49.3% |
| September through the 27th | 17,351 | 53.4% |
A non-overlapping split by citation creation date produces 68,269 links before September 2 UTC, with a top-100 share of 45.7%, and 13,509 links from September 2 onward, with a share of 54.5%. This checks new records separately; it is not an independent randomized replication. The mix changes over time, so we do not claim stable concentration or a causal time trend.
The September 1 proposal's exact snapshot is unavailable. A date-filtered reconstruction does not reproduce its reported row count. We therefore do not present the reported 18% growth as verified sample growth or infer an exact incremental cohort from the difference between proposal counts.
Limitations and appropriate interpretation
The records come from operational API scans of a small, selected group of monitored domains. Repeated prompts and runs produce correlated records. Four included engine families do not represent all AI products or consumer interfaces. Excluding two feeds changes the scope of the conclusion.
We report descriptive proportions, not confidence intervals that assume independent citation rows. A matched, repeated prompt design with run/domain-level uncertainty estimates would be needed for broader inference.
We have not checked every linked page, verified whether each citation supports the answer, measured traffic or linked an outreach action to a later citation. We also have not labeled tier-1 publications. These results cannot establish that smaller publishers outperform major outlets, that any placement will improve AI visibility or that domains near the top of an in-sample ranking will remain there on future prompts.
The appropriate practical use is to separate brand and discovery questions during research, inspect source pages and editorial relevance and test future outcomes with comparable prompts.
Available aggregate assets
Customer-identifying raw records and prompt text are not part of the publication package.